Introduction
Most finance teams collect more data than they can act on. According to 2024 research from FP&A Trends, only 35% of FP&A professionals' time goes toward high-value work like generating insights, while 52% of teams still rely on Excel for planning. Nearly 29% take more than 10 days just to finalise a forecast — a problem that's just as acute for Indian finance teams managing multi-entity books, GST compliance, and rapid growth cycles.
That lag is expensive. A two-week forecast cycle means two weeks of decisions made on stale numbers.
Financial business intelligence (BI) software changes this equation. Rather than waiting for month-end reports assembled across disconnected spreadsheets, FP&A teams get real-time dashboards, automated variance analysis, and scenario models that update as the business moves. The result: faster decisions grounded in cleaner data.
This guide covers five financial BI tools built for FP&A workflows — Microsoft Power BI, Tableau, SAP Analytics Cloud, Workday Adaptive Planning, and Zoho Analytics — evaluated on the features that actually drive planning efficiency: real-time data connectivity, scenario modelling, and integration depth.
Key Takeaways
- Only 35% of FP&A time goes toward strategic work — financial BI tools automate the rest
- The five tools covered range from general BI platforms (Power BI, Tableau) to dedicated FP&A planning engines (SAP Analytics Cloud, Workday Adaptive Planning)
- Zoho Analytics is the strongest India-relevant option for MSMEs, with Zoho Books integration and natural language querying
- Key evaluation criteria: forecasting depth, ERP integration, variance analysis, scalability, and pricing transparency
- For Indian MSMEs, an ERP with built-in financial reporting eliminates the need for a separate BI tool altogether
What Is Financial Business Intelligence and Why FP&A Teams Need It
Financial BI is the practice of collecting, integrating, and analysing financial data from multiple sources — ERP systems, accounting software, CRMs, payroll — then surfacing it through real-time dashboards, forecasts, and reports. Unlike generic BI, financial BI focuses on FP&A-specific metrics: revenue, margins, cash flow, budget variance, and cost-centre performance.
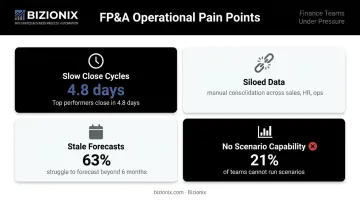
The Pain Points It Solves
FP&A teams face a specific cluster of operational problems:
- Slow close cycles — APQC's 2025 benchmarking data shows top performers close monthly books in 4.8 days or less, while bottom performers take 10 days or more
- Siloed data — finance teams manually consolidate figures from sales, HR, and ops, introducing errors at every handoff
- Stale forecasts — 63% of FP&A professionals struggle to forecast beyond six months (FP&A Trends, 2024)
- No scenario capability — 21% of teams still cannot run scenarios at all (FP&A Trends, 2024)
The cumulative cost is significant. Gartner estimates poor data quality costs organisations at least $12.9M annually on average — a direct consequence of fragmented, manually reconciled data of the kind most FP&A teams still rely on.
That urgency is reflected in adoption trends. Globally, the BI software market was valued at $40.13 billion in 2025 and is projected to reach $81.45 billion by 2033 at a 9.3% CAGR (Grand View Research, 2026). For FP&A teams, purpose-built financial BI tools now directly determine how fast a business can close, forecast, and course-correct.
Best Financial Business Intelligence Software Tools for FP&A Teams
These five tools were selected based on their demonstrated value for FP&A workflows — covering financial planning, forecasting, reporting, and real-time analytics across a range of team sizes and budgets.
Microsoft Power BI
Power BI is one of the most widely adopted BI platforms globally and a natural fit for FP&A teams already working within the Microsoft ecosystem. Its deep Excel integration means finance teams can layer live data connections onto existing financial models without rebuilding from scratch.
What makes it work for FP&A: Power BI connects to a wide range of data sources — ERP systems, cloud databases, accounting platforms — and renders live financial dashboards without requiring coding expertise. Its AI-powered anomaly detection uses the SR-CNN algorithm to flag unusual patterns in time-series data and provide root-cause explanations. Microsoft has been named a Leader in the Gartner Magic Quadrant for Analytics and BI Platforms for 18 consecutive years as of 2025.
| Category | Details |
|---|---|
| Key FP&A Features | Real-time dashboards, Excel integration, AI anomaly detection, broad data source connectivity, automated report scheduling |
| Pricing | Power BI Pro: $14 USD/user/month (billed annually); Power BI Premium Per User: $24 USD/user/month (billed annually) |
| Deployment | Cloud-based and on-premise |
| Best For | FP&A teams embedded in the Microsoft 365 ecosystem seeking scalable, self-service reporting |
One limitation to note: Power BI is a BI and analytics platform, not a dedicated financial planning tool. Teams with complex forecasting or rolling forecast requirements may need to supplement it with a planning layer.
Tableau
Tableau, now part of Salesforce, is a widely used platform for financial data visualisation. Finance teams use it to build interactive P&L analyses, cash flow trend views, and variance reports that executives can explore without IT assistance.
Tableau's drag-and-drop interface lets finance analysts build polished dashboards in minutes. Its "live" and "in-memory" data modes give teams flexibility — real-time analysis when speed matters, pre-aggregated data when volume does. Tableau integrates with major ERP platforms and data warehouses, and its Salesforce CRM integration is particularly valuable for revenue-focused FP&A workflows.
Recognition: Tableau was named a Leader in both the 2025 Gartner Magic Quadrant for Analytics and BI Platforms and the Forrester Wave: Business Intelligence Platforms.
| Category | Details |
|---|---|
| Key FP&A Features | Interactive financial dashboards, live and in-memory data modes, drag-and-drop visual analytics, Salesforce CRM integration, mobile access |
| Pricing | Tableau Cloud Standard: Viewer $15 USD, Explorer $42 USD, Creator $75 USD/user/month (billed annually). Enterprise: Viewer $35 USD, Explorer $70 USD, Creator $115 USD/user/month |
| Deployment | Cloud (Tableau Cloud) and on-premise (Tableau Server) |
| Best For | Finance teams presenting complex data to executive leadership who need polished, navigable financial visualisations |
SAP Analytics Cloud
SAP Analytics Cloud (SAC) is an enterprise-grade platform combining BI, planning, and predictive analytics in one cloud environment. It is particularly relevant for organisations already running SAP ERP.
SAC's unified planning and analytics layer is its core advantage. FP&A teams can build budgets, run scenario simulations, and compare actuals against plan — all within the same platform. This eliminates the data shuttling that affects teams using separate planning and reporting tools. Its AI-assisted forecasting generates baseline predictions from historical data automatically. SAP was recognised as a Leader in the 2025 Gartner Magic Quadrant for Financial Planning Software.
| Category | Details |
|---|---|
| Key FP&A Features | Integrated planning and analytics, scenario modelling, AI-assisted forecasting, SAP ERP native integration, collaborative budgeting workflows |
| Pricing | Enterprise pricing; contact SAP for a quote (licensed via SAP Business Data Cloud capacity model) |
| Deployment | Fully cloud-based |
| Best For | Mid-to-large enterprises with existing SAP infrastructure seeking a single platform for planning and reporting |
Workday Adaptive Planning
Workday Adaptive Planning is purpose-built for FP&A — a dedicated Corporate Performance Management (CPM) platform rather than a general BI tool. Rolling forecasts, driver-based models, what-if scenario analysis, and multi-dimensional planning are all native capabilities rather than add-ons.
The platform pulls actuals from ERP systems automatically to keep financial models current. Workday Adaptive Planning was named a Leader in the Gartner Magic Quadrant for Financial Planning Software for three consecutive years as of 2024.
| Category | Details |
|---|---|
| Key FP&A Features | Rolling forecasts, driver-based planning, what-if scenario modelling, multi-entity consolidation, ERP integration for actuals |
| Pricing | Enterprise-priced SaaS; contact Workday sales for a quote |
| Deployment | Cloud-based SaaS |
| Best For | FP&A teams that need a dedicated planning and forecasting engine with deep financial modelling capabilities |
Zoho Analytics
Zoho Analytics is a self-service BI platform suited to SMBs and growing mid-sized enterprises. For Indian businesses specifically, its affordability, integration with Zoho Books, and local support make it a practical financial BI option.
Zoho's AI assistant, Zia, lets finance teams query data using plain-language questions — no SQL required. The platform supports data blending from accounting systems, spreadsheets, and cloud databases. Zoho Books integration means financial data from invoices, receivables, and payables flows directly into analytics without manual export. Zoho Analytics was recognised for the fourth consecutive year in the 2025 Gartner Magic Quadrant for Analytics and BI Platforms.
| Category | Details |
|---|---|
| Key FP&A Features | AI-powered natural-language querying (Zia), automated financial reports, data blending across sources, Zoho Books integration, predictive analytics and anomaly detection |
| Pricing | Free plan available (2 users, 10,000 rows); paid plans available — contact Zoho or check the official pricing page for current tier amounts |
| Deployment | Cloud-based with on-premise option |
| Best For | Indian SMBs and MSMEs seeking an affordable, user-friendly BI tool with native accounting software integration |
Key Features FP&A Teams Should Look for in a Financial BI Tool
Not all BI tools are built with FP&A workflows in mind. A tool that excels at marketing dashboards may fall short when finance teams need rolling forecasts or multi-entity consolidation.
FP&A-Specific Capabilities
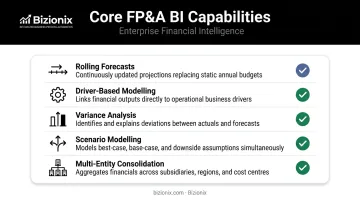
Prioritise tools that offer:
- Rolling forecasts — automatically extending the forecast horizon as each period closes, not just static annual plans
- Driver-based modelling — building forecasts from business drivers (units sold, headcount, utilisation rates) rather than historical averages
- Variance analysis — actuals vs. plan comparisons with drill-down to account and cost-centre level
- Scenario modelling — the ability to run and compare multiple financial scenarios quickly; 21% of FP&A teams still cannot do this at all
- Multi-entity consolidation — essential for organisations managing subsidiaries, branch offices, or multiple GST-registered entities
ERP and Accounting Integration
A financial BI tool is only as useful as the data it pulls in. Evaluate whether the tool connects directly to your existing ERP or accounting platform without heavy IT involvement.
For growing Indian businesses, this means either selecting a BI layer that sits on top of your existing financial data, or choosing an ERP that already surfaces financial reporting natively. For growing Indian businesses, this means either selecting a BI layer that sits on top of your existing financial data, or choosing an ERP that already surfaces financial reporting natively.
Bizionix, for example, includes native reporting as part of its core modules — covering P&L statements, balance sheets, General Ledger, and MIS reports, alongside real-time dashboards. Its multi-company management supports both consolidated group-level views and separate entity books without requiring a separate BI tool.
Security and Compliance
Financial data requires stronger governance than most BI use cases:
- Role-based access controls — restrict report and dashboard access by user role, department, and entity
- Audit trails — full logs of who accessed what and when
- India-specific compliance — for Indian businesses, the tool must align with the Digital Personal Data Protection (DPDP) Act 2023 and relevant SEBI cybersecurity requirements
- Data residency — verify where financial data is stored and whether that meets regulatory requirements
How We Chose the Best Financial BI Tools
Evaluation Approach
These five tools were shortlisted on FP&A-specific suitability, not general BI performance. Brand recognition alone tells you nothing about whether a platform supports rolling forecasts, variance analysis, or the multi-entity structures common in Indian business groups.
Two distinct evaluation tracks were applied:
- ABI platforms (Power BI, Tableau, Zoho Analytics) — assessed for dashboard quality, self-service analytics, data connectivity, and visualisation depth
- EPM/FP&A planning platforms (SAP Analytics Cloud, Workday Adaptive Planning) — assessed for budgeting, forecasting, scenario modelling, and consolidation capabilities
Selection Criteria
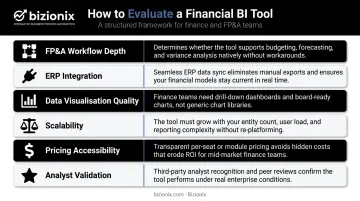
| Criterion | Why It Matters |
|---|---|
| FP&A workflow depth | Does it support rolling forecasts, driver models, and variance analysis natively? |
| ERP/accounting integration | Can it pull actuals automatically without manual exports? |
| Data visualisation quality | Are financial reports accessible to non-technical stakeholders? |
| Scalability | Can it handle growing data volumes and team size without re-platforming? |
| Pricing accessibility | Is the total cost of ownership justified for the team's size and complexity? |
| Analyst validation | Gartner Magic Quadrant, G2, Capterra — independent validation of real-world performance |
All five tools carry Gartner recognition: Power BI, Tableau, and Zoho Analytics in the Gartner Magic Quadrant for Analytics and BI Platforms; SAP Analytics Cloud and Workday Adaptive Planning in the Gartner Magic Quadrant for Financial Planning Software.
Conclusion
Choosing the right financial BI tool matters less when measured against brand recognition and more when measured against your team's actual workflows. A beautifully designed dashboard tool that cannot run a rolling forecast is the wrong tool for an FP&A team that needs rolling forecasts.
Before committing to any platform, ask three questions:
- Does it directly support the planning and forecasting tasks your team runs today?
- Does it integrate cleanly with your existing ERP or accounting system — or does it create a new data silo?
- Is the total cost — subscription, setup, and training proportionate to the efficiency gains?
For Indian MSMEs that need financial reporting, GST-compliant accounting, real-time dashboards, and multi-entity management in one place, Bizionix by IIS-LLP packages all of this into a cloud ERP platform — which means no separate BI tool to license, integrate, or maintain.
See how Bizionix handles financial reporting and multi-entity management for growing Indian businesses.
Frequently Asked Questions
What is financial business intelligence?
Financial business intelligence is the process of collecting, integrating, and analysing financial data from across an organisation (ERP systems, accounting software, CRMs) to produce real-time dashboards, forecasts, and KPI reports. It gives finance leaders faster, more accurate information for decisions than traditional spreadsheet-based reporting.
Which software is mostly used in finance?
Microsoft Power BI and Tableau are the most widely adopted BI platforms in finance, valued for visualisation and broad data connectivity. For dedicated FP&A planning, Workday Adaptive Planning and SAP Analytics Cloud are common choices in mid-to-large enterprises.
What are the 4 types of data analytics?
The four types are: descriptive (what happened), diagnostic (why it happened), predictive (what is likely to happen), and prescriptive (what action to take). In FP&A, descriptive analytics covers variance reporting, while predictive and prescriptive analytics support rolling forecasts and scenario modelling.
What should FP&A teams specifically look for in a BI tool?
Prioritise native support for rolling forecasts, driver-based planning, and variance analysis (actuals vs. plan). ERP integration to pull actuals automatically is non-negotiable, as is role-based access control to protect sensitive financial data from unauthorised access.
Is Microsoft Power BI good for FP&A teams?
Power BI works well for teams already in the Microsoft 365 ecosystem — it handles financial dashboards, ERP data connections, and AI-powered anomaly detection. That said, it is a reporting tool rather than a planning platform, so teams with complex forecasting needs often require a separate solution alongside it.
Can small businesses and MSMEs use financial BI tools?
Yes — Zoho Analytics and Microsoft Power BI both offer accessible entry-level pricing for smaller teams. Indian MSMEs can also opt for a GST-ready cloud ERP with built-in financial reporting (such as Bizionix), which removes the need for a separate BI tool and reduces overall software costs.