Introduction
Most growing businesses aren't short on data — they're short on the ability to use it. Sales figures sit in spreadsheets, inventory updates come via WhatsApp, and financial performance only becomes visible at month-end. For Indian MSMEs especially, decisions still run on instinct rather than information.
That gap is closing fast. Cloud-based analytics tools have matured to the point where a five-person business can access the operational insight that once required a dedicated IT team and an enterprise budget.
According to Fortune Business Insights, the global BI software market is projected to grow from USD 52.89 billion in 2026 to USD 150.24 billion by 2034. Analytics adoption is accelerating across every market, including India.
This guide covers five tools — Microsoft Power BI, Tableau, Zoho Analytics, Google Looker Studio, and Bizionix — selected for their accessibility, pricing transparency, and real-world fit for businesses ranging from small startups to growing mid-sized enterprises.
Key Takeaways
- Business analytics tools help you turn raw operational data into faster, more confident decisions
- Four analytics types — descriptive, diagnostic, predictive, prescriptive — cover the spectrum; most growing businesses should start with the first two
- Choosing the right tool comes down to your team's technical comfort, budget, existing software stack, and whether you need standalone analytics or analytics embedded in your operations
- For Indian MSMEs, affordability, GST compatibility, and ease of use matter more than feature depth
- This guide profiles five tools relevant across different business sizes and budgets
What Is Business Analytics — And Why It Matters in 2026
Business analytics is the use of data, statistical methods, and software to uncover patterns, understand past performance, and forecast future outcomes. It's often confused with business intelligence (BI), which focuses mainly on historical reporting. Modern platforms increasingly blend both.
The Four Types of Analytics
| Type | Question It Answers | Example |
|---|---|---|
| Descriptive | What happened? | Monthly sales by region |
| Diagnostic | Why did it happen? | Which SKUs caused a revenue drop |
| Predictive | What will likely happen? | Demand forecast for next quarter |
| Prescriptive | What should we do? | Recommended reorder quantities |
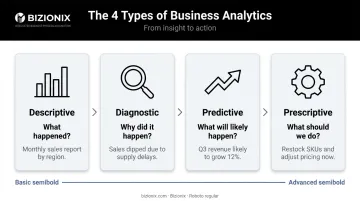
Most growing businesses start with descriptive and diagnostic analytics. Understanding performance and diagnosing problems delivers immediate, practical value — and builds the data discipline needed before predictive modeling makes sense.
Why 2026 Is a Meaningful Inflection Point
Self-service BI tools have made analytics more accessible, yet Forrester research shows that only about 20% of non-IT professionals can currently fulfill their own BI requirements. For most organisations, the tools exist — but they're not built for the people who need them most.
For Indian MSMEs specifically, the picture is mixed. A 2025 India SME Forum survey of 7,835 MSMEs found that 53.8% had adopted at least one digital tool, while 46.2% remained fully offline.
Among those who tried to digitise, 52.6% struggled to find the right tools and 47.7% found daily use challenging. The barrier isn't awareness. It's finding tools built around how Indian businesses actually work — GST compliance, multi-location inventory, and leaner teams with less IT support.
Top Business Analytics Tools for 2026
These five tools were selected based on accessibility for non-technical teams, pricing transparency, integration flexibility, and suitability for businesses ranging from growing SMBs to mid-sized enterprises — not just large corporations.
Microsoft Power BI
Power BI is a cloud-based analytics and visualization platform delivered on Microsoft Azure. Its deep integration with Excel, Office 365, and the broader Microsoft ecosystem makes it a natural fit for organizations already running on Microsoft tools.
Its core strength is self-service data preparation — users can connect live data sources, build dashboards, and generate reports without needing a data engineer. AI-powered features like natural language Q&A and automated insights make it approachable even for non-technical teams.
Microsoft has been named a Leader in the Gartner Magic Quadrant for Analytics and BI Platforms for 18 consecutive years, with Power BI serving over 30 million monthly active users.
| Details | |
|---|---|
| Best For | Teams using Microsoft 365, Excel-heavy workflows, businesses needing affordable self-service BI |
| Key Features | Real-time dashboards, natural language queries, drag-and-drop report builder, AI-powered insights, extensive data connectors |
| Pricing | Free tier available; Pro at $14/user/month (annual); Premium Per User at $24/user/month (annual) |
Tableau
Tableau, now part of Salesforce, is one of the most established names in data visualization. It connects to a wide range of data sources — relational databases, cloud services, spreadsheets, and more — and handles large, complex datasets well.
Visualization depth is where Tableau stands out. Heat maps, trend lines, geographic maps, and interactive dashboards are all achievable through a drag-and-drop interface without writing code. Its Salesforce integration makes it particularly strong for sales-driven organizations wanting to connect pipeline data with operational performance.
Tableau has held a Leader position in Gartner's Magic Quadrant for Analytics and BI Platforms for 12 consecutive years.
| Details | |
|---|---|
| Best For | Organizations with complex multi-source datasets; teams that prioritize visual storytelling; Salesforce users |
| Key Features | Advanced drag-and-drop visualization, hundreds of data connectors, Tableau Prep for data cleaning, embedded analytics, mobile dashboards |
| Pricing | Creator from $75/user/month (Standard); Explorer from $42/user/month; free Tableau Public available |
Zoho Analytics
Zoho Analytics is built by Zoho Corporation — an Indian software company — which gives it natural advantages for Indian businesses: competitive pricing calibrated for the local market, Zoho ecosystem compatibility, and integrations relevant to Indian operations.
Users can pull data from Zoho CRM, Zoho Books, third-party applications, and spreadsheets, then blend it into cross-functional reports. The AI assistant Zia answers business questions in plain language, generating KPI widgets and reports automatically — useful for business owners without a dedicated data team. Smart alerts flag anomalies or outliers as they occur. Zoho Analytics has been recognized in the Gartner Magic Quadrant for Analytics and BI Platforms for four consecutive years, with over 17,000 customers and 75 million reports generated on the platform.
| Details | |
|---|---|
| Best For | Indian SMBs using Zoho ecosystem apps; teams needing affordable BI without technical overhead |
| Key Features | Drag-and-drop dashboards, AI assistant (Zia), 50+ data connectors, automated reporting, smart data alerts, shareable reports |
| Pricing | Starts at $25/month for 2 users; free plan available with limited rows; verify INR pricing directly with Zoho India |
Google Looker Studio
Formerly Google Data Studio, Looker Studio is a free data visualization and reporting tool that connects natively to Google Analytics, Google Sheets, BigQuery, and over 1,400 data sources. No installation required. No software budget needed.
Reports refresh automatically from connected live sources and can be shared interactively with stakeholders. For small businesses or marketing teams already working within Google Workspace, it's the most practical starting point — capable enough for most basic reporting needs, with zero cost to entry. One limitation worth noting: Google Analytics data refreshes every 12 hours and cannot be changed, so it's not suited for real-time operational monitoring.
| Details | |
|---|---|
| Best For | Small businesses, startups, and marketing teams needing free reporting on Google-ecosystem data |
| Key Features | Free to use, live data connections, drag-and-drop report builder, shareable interactive dashboards, 1,400+ connectors |
| Pricing | Free; Looker Studio Pro at $9/user/project/month for team workspaces and enhanced scheduling |
Bizionix
Bizionix is a 100% cloud-based ERP and business management platform built specifically for Indian MSMEs by IIS-LLP, a subsidiary of Protocol India Private Limited with over two decades of industry experience.
The meaningful difference between Bizionix and standalone analytics tools comes down to data architecture. Tools like Power BI or Looker Studio need clean, connected data pipelines to function well. If your business data lives in disconnected spreadsheets, separate accounting software, and manually updated inventory records, a standalone analytics tool will only surface the quality of data it receives.
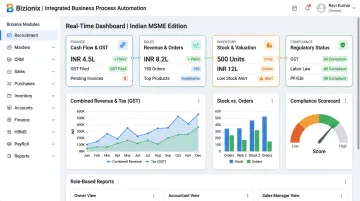
Bizionix eliminates that foundational problem by unifying all business operations — finance, sales, inventory, procurement, HRMS, and GST compliance — into one platform. Because the data feeding those dashboards is already clean and structured, real-time reporting is available immediately. Every team works from one consistent data set, with role-based access controlling what each user sees.
For multi-entity businesses such as holding companies, franchise networks, and CA firms managing multiple clients, a single secure login provides consolidated group-level analytics alongside the ability to drill into individual entity performance.
On the compliance side, Bizionix includes automated GST e-invoicing with instant IRN generation, GSTR-1 auto-population, and full audit trails — covering Indian regulatory requirements without manual intervention.
The analytics layer includes:
- Real-time operational dashboards across all modules
- Customizable reports and advanced business intelligence
- Industry-specific reporting for hospitality (RevPAR, ADR, occupancy analytics)
- Configurable role-based views for finance, sales, and operations
| Details | |
|---|---|
| Best For | Indian MSMEs, CA firms, hotels, manufacturing companies, franchise networks, and multi-location enterprises needing integrated operations + analytics |
| Key Features | Real-time operational dashboards across all modules, GST-ready accounting, automated e-invoicing (IRN generation), multi-company management, role-based access, configurable reports, unified data across departments |
| Pricing | NEO plan from ₹999/year; Enterprise plan with custom pricing — contact info@bizionix.com or +91 91779 99277 |
How to Choose the Right Business Analytics Tool
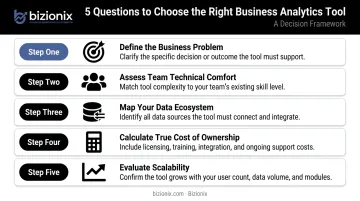
The right tool depends on your actual business context — not the longest feature list. Work through these five questions before shortlisting any platform:
1. What business problem are you actually solving? Executive dashboards, marketing attribution, operations efficiency monitoring, and financial forecasting each require different capabilities. Defining this first prevents paying for complexity you won't use.
2. What's your team's technical comfort level? Looker Studio and Power BI are designed for non-technical users. Tableau has a steeper learning curve but greater visualization flexibility. Prioritize tools with strong onboarding support and drag-and-drop interfaces if your team has limited data experience.
3. What does your data ecosystem look like today?
- Microsoft 365 users → Power BI integrates naturally
- Zoho app users → Zoho Analytics is the logical choice
- Google Workspace users → Start with Looker Studio for free
- Data scattered across spreadsheets and disconnected tools → An integrated ERP like Bizionix that unifies the data first may be the more practical starting point
4. What's the true cost of ownership? License price is just one line item. The costs that accumulate over 24 months are:
- Implementation time and internal resource commitment
- Training effort across departments
- Per-user fees that multiply as the team grows
Flat-rate annual pricing (like Bizionix's model) is more predictable for growing teams than per-user structures.
5. Will this tool scale with the business? Verify whether the tool supports API integrations with your CRM, accounting software, and inventory systems — and whether data volume growth triggers significant cost increases.
How We Selected These Tools
These five tools were chosen against a consistent set of criteria:
- Market presence and user adoption among Indian businesses
- Free or accessible entry tier to lower the barrier for MSMEs
- Relevance to the Indian context — pricing in INR, GST compatibility, and language support
- Ease of use for non-technical owners who don't have dedicated IT teams
- Integration breadth with common Indian accounting, billing, and ERP systems
That last point matters more than most buyers realize. Many businesses pick tools based on brand recognition or feature lists, then discover the tool doesn't connect to their actual data sources — or that no one on the team has time to learn it. A tool your team uses consistently will deliver more value than the most feature-rich option sitting unused.
Conclusion
Business analytics isn't a large-enterprise privilege anymore. In 2026, the combination of affordable cloud pricing, no-code interfaces, and India-specific platforms means any growing business can start making data-driven decisions this quarter, without waiting on a six-month IT project.
A few practical steps to begin:
- Pick one specific use case rather than trying to solve everything at once
- Trial one or two tools before committing to a platform
- Keep your underlying data clean and consistently updated — fragmented data limits what any analytics tool can deliver
For Indian MSMEs that want to build that clean data foundation while gaining real-time operational visibility simultaneously, Bizionix was built for exactly that challenge. Reach out at info@bizionix.com or visit bizionix.com to learn more.
Frequently Asked Questions
What is the best software for business analysis?
The right tool depends on team size, technical skill level, budget, and existing software stack. Power BI and Zoho Analytics work well for small to mid-sized businesses, while Bizionix suits Indian MSMEs that need integrated operational analytics without building a separate data infrastructure.
What is the difference between business analytics and business intelligence?
Business intelligence focuses on understanding what happened through historical reporting and dashboards. Business analytics extends into predicting future outcomes and recommending actions. Modern platforms increasingly combine both capabilities in one interface.
What are the 4 types of business analytics?
Descriptive (what happened), diagnostic (why it happened), predictive (what will happen), and prescriptive (what should be done). Most growing businesses start with descriptive and diagnostic before investing in predictive or prescriptive capabilities.
Do I need technical skills to use business analytics tools?
Most modern tools — Power BI, Zoho Analytics, and Looker Studio included — are built for non-technical users through drag-and-drop interfaces and natural language queries. That said, having someone who understands your underlying data and can validate dashboard accuracy is still valuable, even without coding skills.
Which tools are best for small and medium businesses in India?
Zoho Analytics (Indian pricing, Zoho ecosystem integration), Google Looker Studio (free, no setup needed), and Bizionix (ERP with built-in GST compliance and multi-company analytics for Indian MSMEs) are the strongest starting points.
How much do business analytics tools typically cost?
Pricing ranges from free (Looker Studio) to $14–$75+ per user per month for platforms like Power BI and Tableau. Bizionix's NEO plan starts at ₹999 per year. Always factor in setup, training, and ongoing administration costs — not just the listed license fee.