The catch is that Excel's results depend almost entirely on how the workbook is built. A poorly structured sheet gives you false stock numbers and a false sense of control. A well-designed one functions as a genuine inventory and sales dashboard.
This guide covers what to prepare, how to build each sheet step by step, which formulas make it self-calculating, and — just as importantly — when this approach will stop serving your business.
Key Takeaways
- Excel works as a free inventory and sales system when built with the right five-sheet structure and linked formulas
- Works best for single-location businesses handling under a few hundred transactions a month, with one or two people managing the file
- Start with three non-negotiable sheets — Product Master, Purchases, and Sales — linked through a consistent item code
- VLOOKUP pulls product details automatically; SUMIF calculates running stock and sales totals across sheets
- Hard limits apply: no multi-user access, no real-time syncing, and no GST-compliant invoicing or e-invoice generation
How to Build the System: Step-by-Step
Step 1: Plan Your Workbook Before You Build
Most Excel inventory systems fail before a single formula is written, simply because the workbook has no structure behind it.
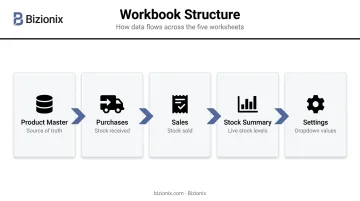
Create five tabs before entering any data:
| Tab Name | Purpose |
|---|---|
| Product Master | Central product list — the source of truth |
| Purchases | Records all stock received |
| Sales | Records all stock sold |
| Stock Summary | Auto-calculates current stock per item |
| Settings | Stores dropdown values (categories, suppliers, units) |
Naming tabs clearly matters. You'll be referencing them in formulas constantly.
Fields to plan for Indian MSMEs:
For each product, capture: Item Code, Item Name, Category, Unit of Measure (UOM), HSN Code, GST Rate (%), Purchase Price, and Selling Price. Under CBIC Rule 46, a valid tax invoice must include HSN code, quantity with unit, taxable value, and GST rate. Setting these fields up from the start makes compliance work significantly easier later.
Only add fields you'll actually maintain. An abandoned column is worse than no column.
Step 2: Build the Product Master Sheet
The Product Master is the backbone of the entire system. Every other sheet pulls from it.
Columns to include:
- Item Code
- Item Name
- Category
- Unit of Measure
- HSN Code
- GST Rate (%)
- Purchase Price
- Selling Price
- Reorder Quantity
- Reorder Level
The Item Code is your primary key. It links the Purchases sheet, Sales sheet, and Stock Summary together. This code must be identical across every tab — no spaces, no variant spellings, and case must be consistent throughout.
A practical format: use a prefix plus a number — RICE001, OIL002, SOAP003. Keep it short and consistent.
Lock this sheet after setup. In Excel: Review → Protect Sheet. Set a password so day-to-day users can't accidentally edit an item code or change a price, which would silently corrupt every linked formula across the workbook.
Step 3: Create the Purchases (Stock In) Sheet
Every stock receipt gets its own row here. When a supplier delivers goods, you enter one row per item received — quantity, price, and date.
Columns:
- Date
- Purchase Order No.
- Supplier Name
- Item Code (entered manually — this triggers the auto-fills)
- Item Name (auto-filled via VLOOKUP)
- Quantity Received
- Purchase Price (auto-filled via VLOOKUP)
- Total Value (Quantity × Purchase Price)
The VLOOKUP formula for Item Name:
=IFERROR(VLOOKUP(D2, ProductMaster, 2, FALSE), "")
Where D2 is the Item Code cell, ProductMaster is the named range covering your Product Master table, 2 is the column number for Item Name, and FALSE forces an exact match.
Wrap every VLOOKUP in IFERROR. This returns a blank instead of #N/A when the Item Code hasn't been entered yet, keeping the sheet clean.
Step 4: Build the Sales Tracking Sheet
The Sales sheet mirrors Purchases in structure, but tracks outgoing stock and captures GST data per transaction.
Columns:
- Date
- Invoice/Order No.
- Customer Name
- Item Code
- Item Name (auto-filled via VLOOKUP)
- Quantity Sold
- Selling Price (auto-filled via VLOOKUP)
- Total Revenue (Quantity × Selling Price)
- GST Amount (auto-calculated)
GST Amount formula:
=IFERROR((H2 * VLOOKUP(D2, ProductMaster, 6, FALSE)) / 100, "")
Here, H2 is Total Revenue and column 6 in the Product Master is GST Rate (%). This auto-calculates the tax on each sale entry, useful for internal reconciliation.
Step 5: Set Up the Stock Summary Sheet
The Stock Summary reads directly from both Purchases and Sales to show live stock levels — without any manual counting. It uses SUMIF to pull totals per item and calculates current stock automatically.
Core columns and formulas:
| Column | Formula |
|---|---|
| Item Code | Pulled from Product Master |
| Total Received | =SUMIF(Purchases!D:D, A2, Purchases!F:F) |
| Total Sold | =SUMIF(Sales!D:D, A2, Sales!F:F) |
| Current Stock | =B2 - C2 |
| Reorder Level | =VLOOKUP(A2, ProductMaster, 10, FALSE) |
| Stock Status | =IF(D2 < E2, "Reorder Now", "OK") |
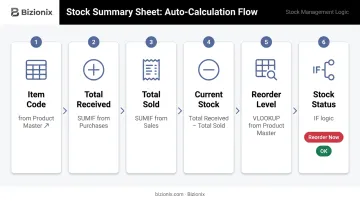
Apply conditional formatting to the Stock Status column: go to Home → Conditional Formatting → Highlight Cell Rules → Text that Contains → "Reorder Now" and set a red fill. At a glance, you'll see exactly which items need attention.
Dashboard summary at the top of the Stock Summary sheet:
Add three summary cells above the main table:
- Total Inventory Value:
=SUMPRODUCT(D2:D200, VLOOKUP(A2:A200, ProductMaster, 7, FALSE))— multiplies Current Stock by Purchase Price per item and sums the result - This Month's Revenue:
=SUMIFS(Sales!H:H, Sales!A:A, ">="&DATE(YEAR(TODAY()), MONTH(TODAY()), 1))— totals revenue from the first day of the current month - SKUs Below Reorder Level:
=COUNTIF(F2:F200, "Reorder Now")— gives a single number showing how many items need attention
Key Formulas That Make the System Work
VLOOKUP for Auto-Filling Product Data
=VLOOKUP(lookup_value, table_array, col_index_num, [range_lookup])
lookup_value— the Item Code you're searching fortable_array— the Product Master range (use a named range here)col_index_num— which column number to return (1 = Item Code, 2 = Item Name, etc.)[range_lookup]— always use FALSE for exact match; omitting this defaults to approximate match and will return wrong results
Always wrap with IFERROR: =IFERROR(VLOOKUP(...), "") prevents #N/A errors from appearing when rows are empty.
SUMIF vs. SUMIFS for Stock Totals
Use SUMIF when you have one condition — total quantity received for a single item:
=SUMIF(Purchases!D:D, A2, Purchases!F:F)
Use SUMIFS when you need multiple conditions — for example, total sales of one item in a specific month:
=SUMIFS(Sales!F:F, Sales!D:D, A2, Sales!A:A, ">="&DATE(2025,1,1), Sales!A:A, "<="&DATE(2025,1,31))
One key difference to keep in mind: SUMIFS puts the sum_range first, then alternating criteria range–criteria pairs. This is the reverse of SUMIF's order, so mixing them up is a common source of errors.
Named Ranges
Hardcoding 'Product Master'!A:J into every formula creates fragility — one sheet rename breaks everything. Named ranges fix this. To set one up:
- Select the Product Master table
- Go to Formulas → Define Name, type
ProductMaster, click OK - Replace all raw references with
ProductMasterin your formulas
Every VLOOKUP using ProductMaster will automatically include new rows as you add them.
Data Validation
Dropdowns for Item Code, Category, and Supplier fields stop entry errors before they happen. To configure:
- Select the target column, go to Data → Data Validation → List
- Set the source to your Settings sheet range
- Lock in the same list for all data entry sheets
One typo in an item code breaks every SUMIF and VLOOKUP referencing that code — validation removes that risk entirely.
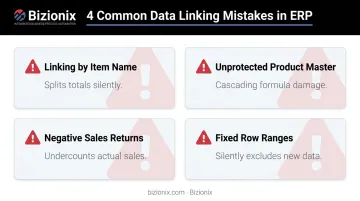
Common Mistakes to Avoid
These mistakes rarely trigger error messages. Instead, they produce wrong numbers that look perfectly valid — and that's what makes them dangerous.
Linking by item name instead of item code means Excel treats "Rice 5kg" and "rice 5 kg" as separate entries. SUMIF silently splits totals across both, and your stock count is off with no warning.
Leaving the Product Master unprotected invites accidental edits. A single change to an item code or price cascades across every connected sheet — damage that often goes undetected until a physical stock count.
Entering a sales return as a negative quantity in the Sales sheet distorts your data. Returns belong in the Purchases sheet as incoming receipts — negative values in SUMIF calculations undercount what was actually sold.
Fixed ranges like
B2:B100break quietly as your data grows. Once purchases exceed row 100,=SUMIF(Purchases!D2:D100, A2, Purchases!F2:F100)silently excludes everything beyond it. Switch to full-column references (D:DandF:F) — Excel expands these automatically.
When Excel Isn't Enough — And What to Do Next
An Excel system built well will serve a small business through its early growth. But specific warning signs indicate when the structure has hit its ceiling:
- The file slows down noticeably when opening or saving
- More than one person needs to update the file simultaneously
- A formula breaks and no one can trace why
- GST return filing requires manually copying data out of Excel into another tool
- Stock is managed across more than one location
Dedicated Cloud ERP (The Right Long-Term Answer)
When a business needs multi-user access, multi-location stock tracking, or GST-compliant invoicing with IRN generation, spreadsheets cannot bridge that gap. A tax invoice under CBIC Rule 46 requires specific fields that Excel won't validate or enforce.
Businesses with aggregate annual turnover above ₹5 crore must generate e-invoices with an IRN through the government's Invoice Registration Portal — a process Excel has no native path for.
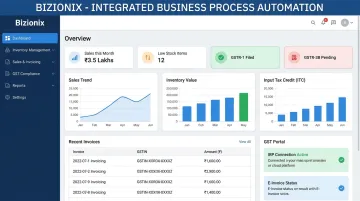
Platforms like Bizionix are built specifically for Indian MSMEs and handle inventory, sales, GST accounting, and e-invoicing within a single integrated system. Bizionix connects directly to the IRP via API, generating IRN and QR codes the moment a sales invoice is created.
It also auto-populates GSTR-1 from your sales data, cutting out the manual data transfer that makes Excel-based GST compliance error-prone.
The entry-level Bizionix NEO plan starts at ₹999 per year (under ₹84 per month) and includes sales, warehouse, accounts, finance, and reporting modules. A 14-day free trial is available. Run both systems in parallel for two weeks and track where time actually goes — that's the clearest test.
Free Standalone Inventory Apps
If your only need is basic stock tracking without full sales integration, there are lighter options. Zoho Inventory's free tier handles up to 50 orders per month and is GST-ready for India. Odoo offers a free Community edition, though India-specific GST features vary by version and configuration.
Both handle single-location operations more reliably than Excel, but all free tiers cap users, locations, and transaction volumes — limits that tend to appear right when the business picks up pace.
Upgrading Excel with Add-ons
Google Sheets with Apps Script can add basic automation — auto-triggering stock calculations, sending email alerts when stock drops below reorder levels. Power Query in Excel can consolidate data from multiple source files automatically. These are reasonable middle steps for businesses not ready to pay for software, but they still lack real-time multi-user sync and built-in compliance features.
Conclusion
A five-sheet Excel workbook — Product Master, Purchases, Sales, Stock Summary, and Settings — with VLOOKUP and SUMIF as the core formulas, gives a small business a functional, free inventory and sales management system. The system works when item codes are consistent, data entry is disciplined, and the Product Master is protected from accidental edits.
Most failures aren't Excel's fault. They come from skipping structure: no item codes, no sheet linking, no data validation. Getting these foundations right pays off beyond just making Excel work — businesses that build this system properly end up with clean, structured data. When they're ready to move to a dedicated cloud ERP like Bizionix, that migration becomes a straightforward export rather than a months-long cleanup exercise.
Frequently Asked Questions
Frequently Asked Questions
Is there free inventory and sales management software?
Yes — Zoho Inventory (free tier, 50 orders/month), Odoo Community, and Square offer free options, but all carry limits on users, locations, or transaction volumes. Excel remains the most flexible zero-cost option for very small businesses that need combined inventory and sales tracking without per-transaction restrictions.
Can Excel handle both inventory and sales tracking at the same time?
Yes, by connecting a Purchases sheet and Sales sheet to a central Product Master using SUMIF formulas, Excel auto-calculates current stock after every entry. The key requirement is a consistent item code across all three sheets — without it, the formulas return incorrect totals.
What formulas are essential for an Excel inventory system?
Four formulas carry the system:
- VLOOKUP — auto-fills item details from the Product Master
- SUMIF/SUMIFS — totals quantities purchased and sold per item
- IF with conditional formatting — flags low stock automatically
- IFERROR — prevents error messages from breaking the sheet when cells are empty
How often should I update my Excel inventory records?
Update the file after every purchase received and every sale made. At minimum, a daily end-of-day update is necessary — delayed entries cause stock totals to drift from reality, making the data unreliable for ordering or sales decisions.
What are the biggest limitations of using Excel for inventory and sales?
Three hard limits apply:
- No multi-user access — only one person can update the file at a time
- Fully manual — every transaction requires individual data entry with no automation
- No GST compliance — Excel cannot generate GST-compliant invoices or the IRN required for e-invoicing under Indian GST regulations
When should a business move from Excel to dedicated inventory software?
Move when more than two people need to update the file, when monthly transaction volumes create consistent data errors, or when GST-compliant invoicing and real-time stock visibility across multiple locations become operational requirements. At that point, the manual workarounds cost more time than the software would.